Kalkulator Tiger Algebra
Normal and standard normal distributions
[Translated] Normal distribution
A normal distribution (also known as Gaussian, Gauss, or Laplace–Gauss distribution, or the bell curve) is a probability distribution that relates a cumulative probability with a random variable . The center of a normal distribution is always located at the mean, across which the distribution is completely symmetrical.

Notations
Statisticians typically use capital letters to represent random variables and lower-case letters to represent their values. For example:
Other examples
: What is the probability that is greater than ?
: What is the probability that is less than ?
: What is the probability that is between and ?
: What is the probability that is greater than and less than ?
Parameters of the normal distribution
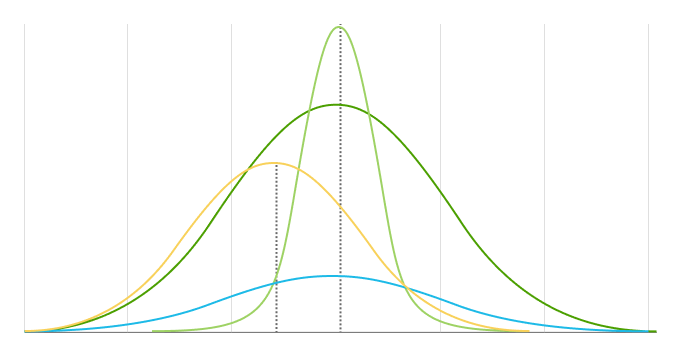
The mean and standard deviation are the two main parameters of a normal distribution. They determine both the distribution's shape and probabilities.
Mean
or
The mean is the location of a distribution's center and peak, meaning any changes to the mean move the distribution curve to the left or right along the x-axis. Most data points (values) are located around the mean.
Standard deviation
or
The standard deviation measures how far away data points are from a distribution's mean. It determines the width of a normal distribution. A larger standard deviation results in shorter, wider curves and smaller standard deviations results in taller, narrower curves.
Properties of the normal distribution
A normal distribution (also known as Gaussian, Gauss, or Laplace–Gauss distribution, or the bell curve) is a probability distribution that relates a cumulative probability with a random variable . The center of a normal distribution is always located at the mean, across which the distribution is completely symmetrical.

Notations
Statisticians typically use capital letters to represent random variables and lower-case letters to represent their values. For example:
- is the value of the random variable .
- represents the probability of .
- represents the probability that the random variable is equal to a particular value . For example, refers to the probability that the random variable is equal to .
Other examples
: What is the probability that is greater than ?
: What is the probability that is less than ?
: What is the probability that is between and ?
: What is the probability that is greater than and less than ?
Parameters of the normal distribution
The mean and standard deviation are the two main parameters of a normal distribution. They determine both the distribution's shape and probabilities.
Mean
or
The mean is the location of a distribution's center and peak, meaning any changes to the mean move the distribution curve to the left or right along the x-axis. Most data points (values) are located around the mean.
Standard deviation
or
The standard deviation measures how far away data points are from a distribution's mean. It determines the width of a normal distribution. A larger standard deviation results in shorter, wider curves and smaller standard deviations results in taller, narrower curves.
Properties of the normal distribution
- It is symmetrical
The normal distribution is perfectly symmetrical, meaning the distribution curve can be folded in the middle, along the mean, to produce two identical halves. This symmetric shape is the result of one-half of the observations falling on each side of the curve. - The mean, median, and mode are all equal
Because the normal distribution is symmetrical, its center represents the average, or mean, of all the data points. This means that its median (the value in the middle of a set when its values are ordered from least to greatest) is also located at the distribution center and is the same as the mean. The peak, the tallest point of ...
