
Tiger Algebra Calculator
Statistical measures
Overview:
The science of statistics deals with the collection, analysis, interpretation, and presentation of data. Statistics often deals with populations, which can best be thought of as groupings of persons, things, or objects. To gain information about a population, we can select a smaller sample, often referred to as a subset, that is representative of the population of a whole. The more representative the sample is of the population, the more accurate the data.As an example, if you were calculating the overall grade point average at your school, you might select a few students from each grade or class instead of the entire student body. The data collected from the sample would be the students’ grade point averages, the population would be all the students at your school, and the sample would be the selected students.
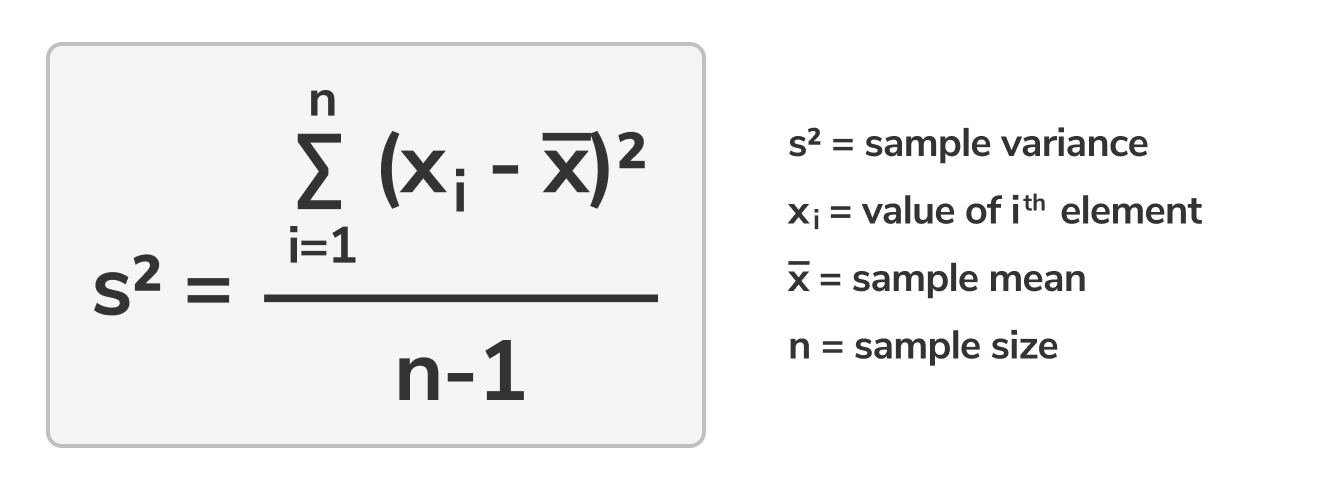
Sample variance formula:
Relevant concepts:
- Mean: The average of all the numbers in the set. To find the mean, add up all the numbers then divide the result by the number of terms in the set. The mean is sometimes also called the arithmetic mean.
- Median: The middle term of a sorted list of numbers. In a set with an even number of terms, the median is equal to the mean of the two center terms.
- Range: The difference between the smallest and largest values in the set. Subtract the smallest number in the set from the largest.
- Variance: How far each number in a set is from the mean and, therefore, from every other number in the set. The larger the variance, the farther the numbers in the set are from the mean and each other. The variance of a sample is often represented by the symbol while the variance of a population is often represented by the symbol . In statistics, it is more common to find the variance for a sample. The variance is calculated by squaring the differences between each number in the data set and the mean to make them positive, adding them all together to find their sum, and finally dividing the sum by the number of values in the data set minus 1. We subtract 1 from the number of values to correct the bias we get from using a sample instead of a whole population. This is called Bessel’s correction.
- Standard Deviation: The dispersion, or spread, of a dataset relative to its mean. While variance gives us a rough idea of spread, the standard deviation gives us the exact distances between terms in the set and the set's mean. If the data points are further from the mean, there is a higher deviation within the data set; therefore, the more spread out the data, the higher the standard deviation. The standard deviation is equal to the square root of the variance.