
Tiger Algebra Calculator
Quadratic Inequalities
Quadratic inequalities are almost exactly the same as quadratic equations; the main difference is that quadratic inequalities have an inequality sign and quadratic equations have an equal sign. While quadratic equations' solutions represent the roots, or x-intercepts, of parabolas, quadratic inequalities' solutions represent the intervals between parabolas' roots on a graph.
There are several standard forms that quadratic inequalities can take. They are:
In these forms, , and represent coefficients and represents a variable that falls within the interval described by the inequality and, when substituted in place of , renders a true mathematical statement (for example, ). In order to find these intervals, we need to first understand where the parabola's roots are located. This can be determined using factorization or the quadratic formula. Lastly, we need to decide in which of the intervals correctly solves the inequality.
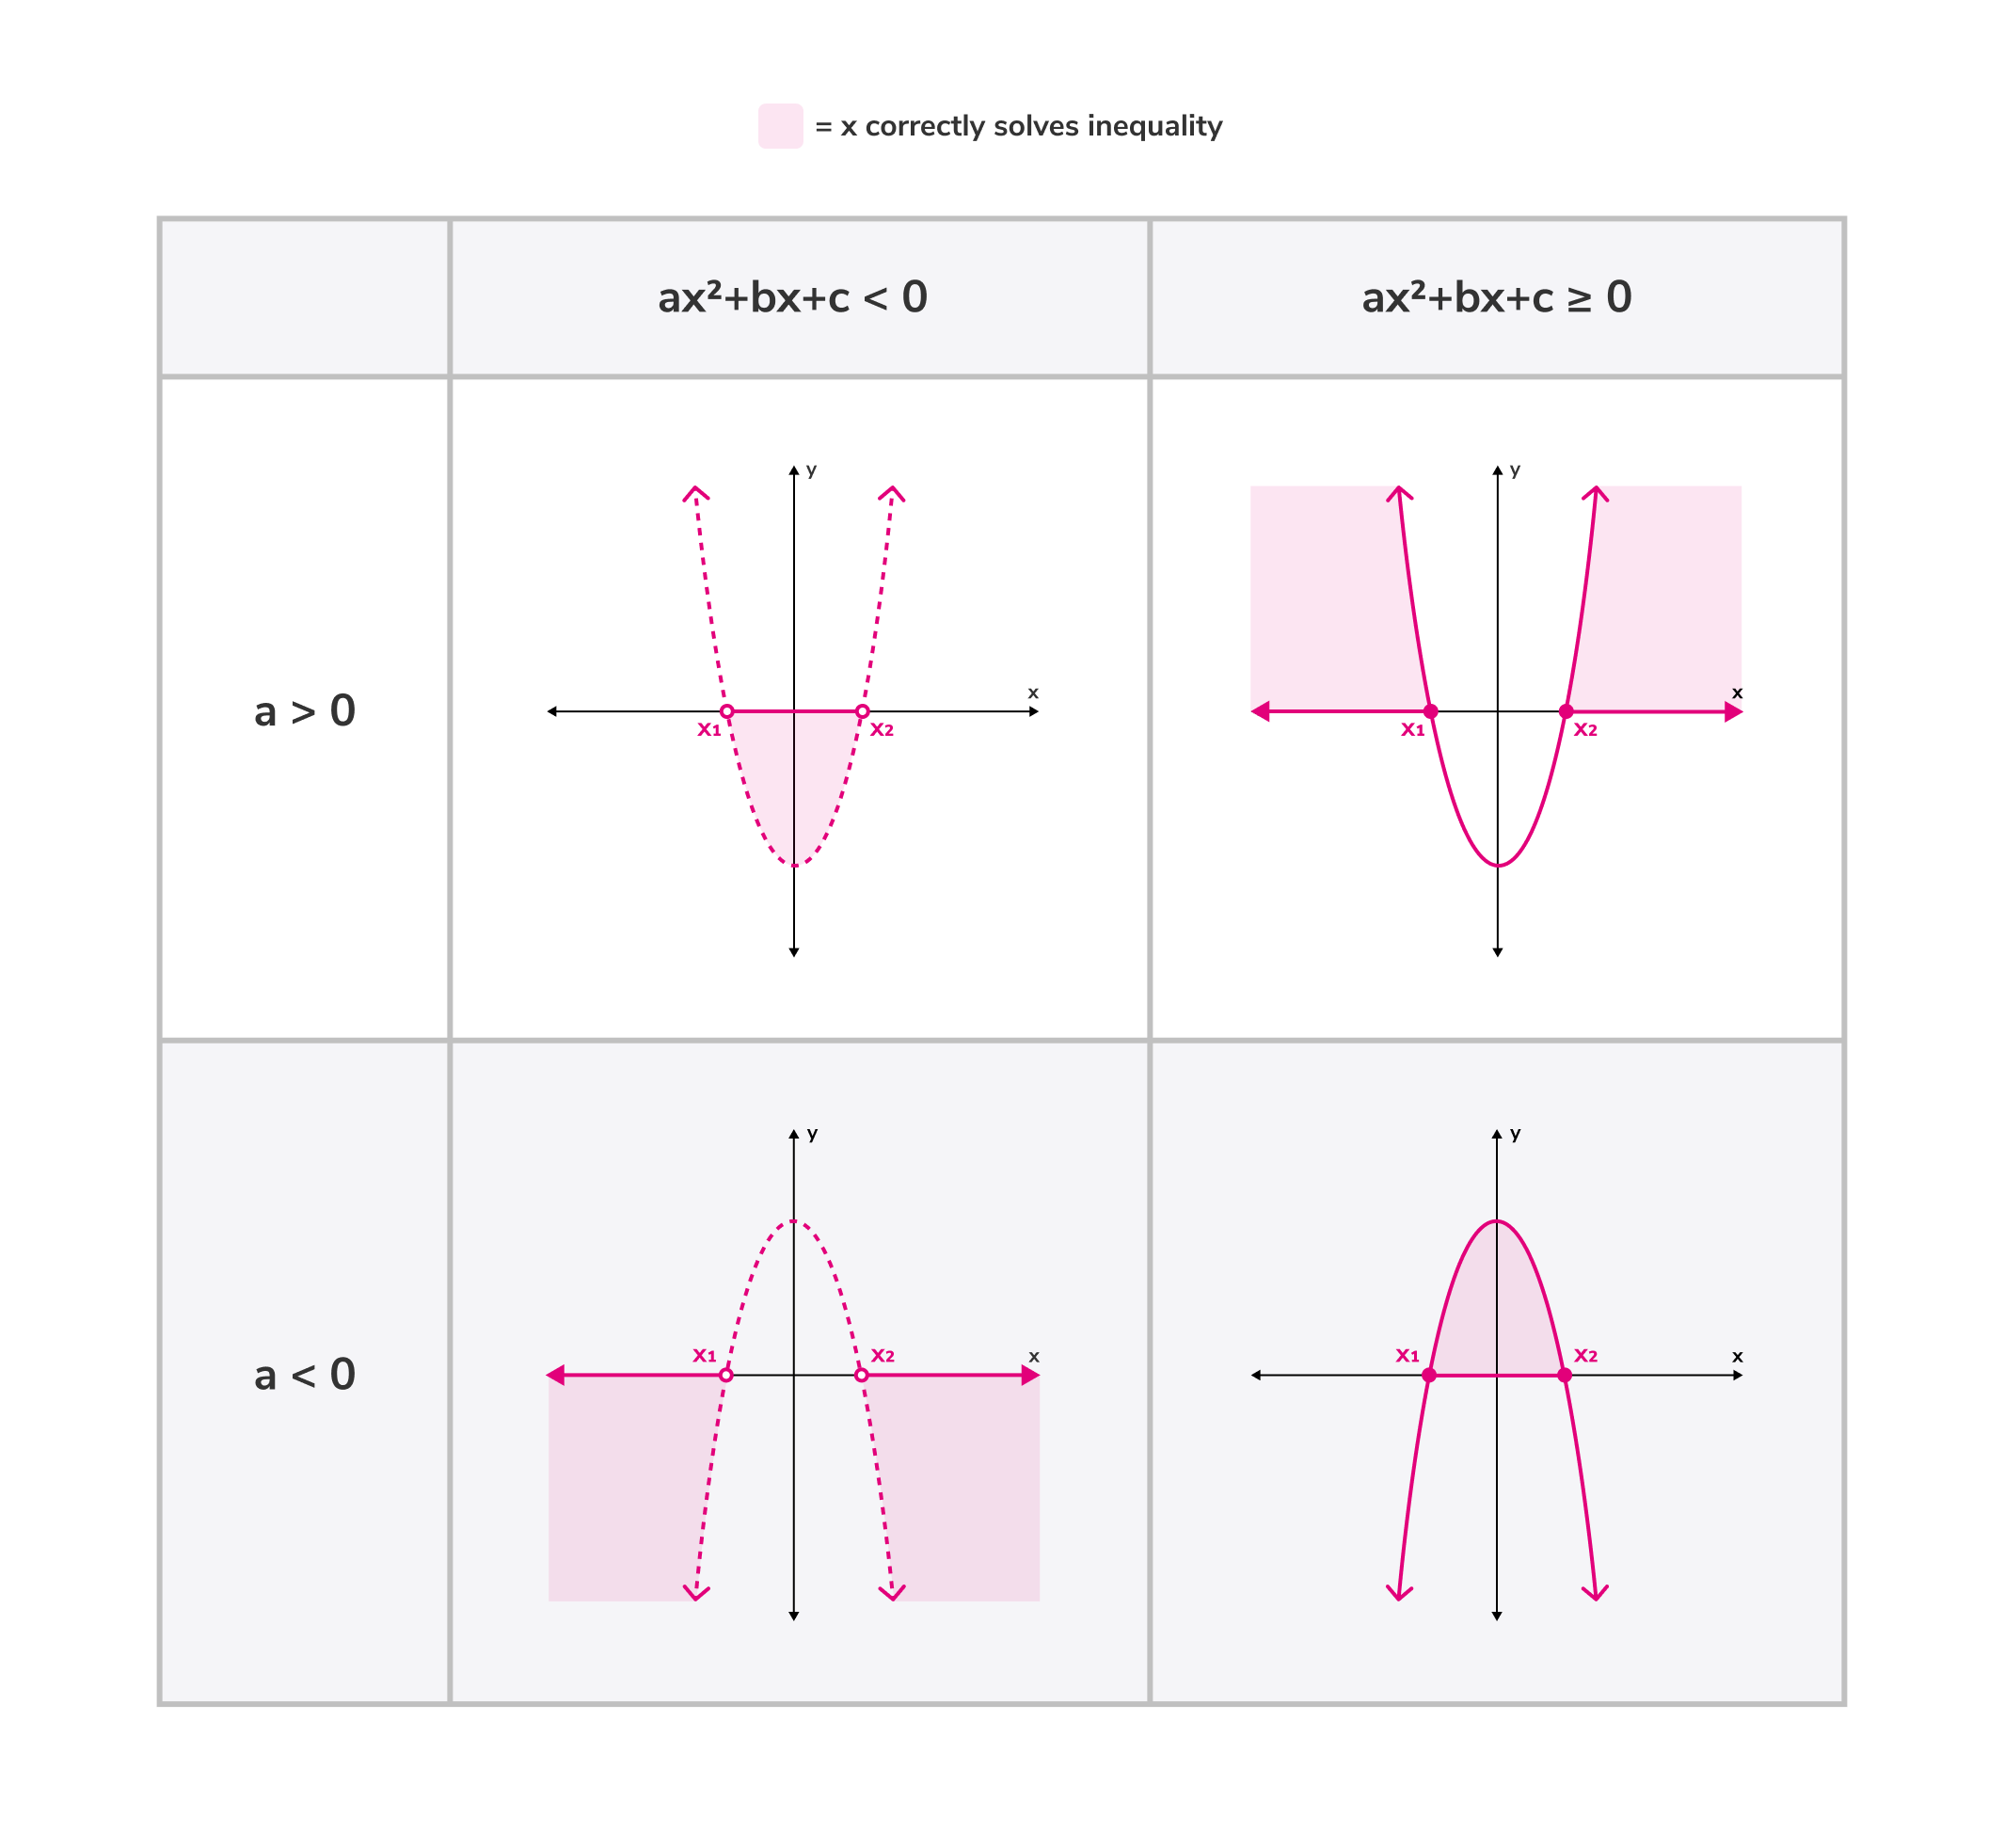
If the sign in the inequality is ≤ or ≥ then its roots are included in the interval and its parabola is drawn on a graph with a solid line. If the sign of the inequality is < or > then its roots are not included in the interval and its parabola is drawn on a graph with a dotted line.
When solving an inequality (much like when solving an equation), anything you do to one side of the inequality, you must also do to the other side of the inequality.
Learn how to solve quadratic inequalities
There are several standard forms that quadratic inequalities can take. They are:
In these forms, , and represent coefficients and represents a variable that falls within the interval described by the inequality and, when substituted in place of , renders a true mathematical statement (for example, ). In order to find these intervals, we need to first understand where the parabola's roots are located. This can be determined using factorization or the quadratic formula. Lastly, we need to decide in which of the intervals correctly solves the inequality.
If the sign in the inequality is ≤ or ≥ then its roots are included in the interval and its parabola is drawn on a graph with a solid line. If the sign of the inequality is < or > then its roots are not included in the interval and its parabola is drawn on a graph with a dotted line.
When solving an inequality (much like when solving an equation), anything you do to one side of the inequality, you must also do to the other side of the inequality.
Learn how to solve quadratic inequalities